Outlook: Digitalization for Sustainable Plant Energy Management
Digital tools are reshaping how plants track and reduce energy use. This outlook highlights six shifts buyers should plan for, from real-time metering to predictive maintenance, and explains how to prepare your facility for data-driven sustainability improvements.
- Real-time metering at the machine level is becoming standard for tracking energy use.
- Digital twins and predictive analytics help reduce downtime and wasted energy before it happens.
- Integrating plant data with sustainability reporting makes compliance and internal tracking easier.
- Staff training is a major bottleneck for adopting digital energy tools.
- Start with baseline data collection before investing in complex automation.
Why data visibility is the first step in plant efficiency
Plants often know their total electricity bill. They rarely know which machine, cycle, or shift is consuming the most power. The gap between knowing the number and acting on it is where energy waste hides. A facility might receive a monthly invoice showing a spike in consumption, but without machine-level granularity, the engineering team cannot isolate the fault. It could be a motor running inefficiently, a vacuum pump cycling unnecessarily, or a line idling while the boiler remains on standby. Without visibility, the cost of that inefficiency remains buried in the aggregate.
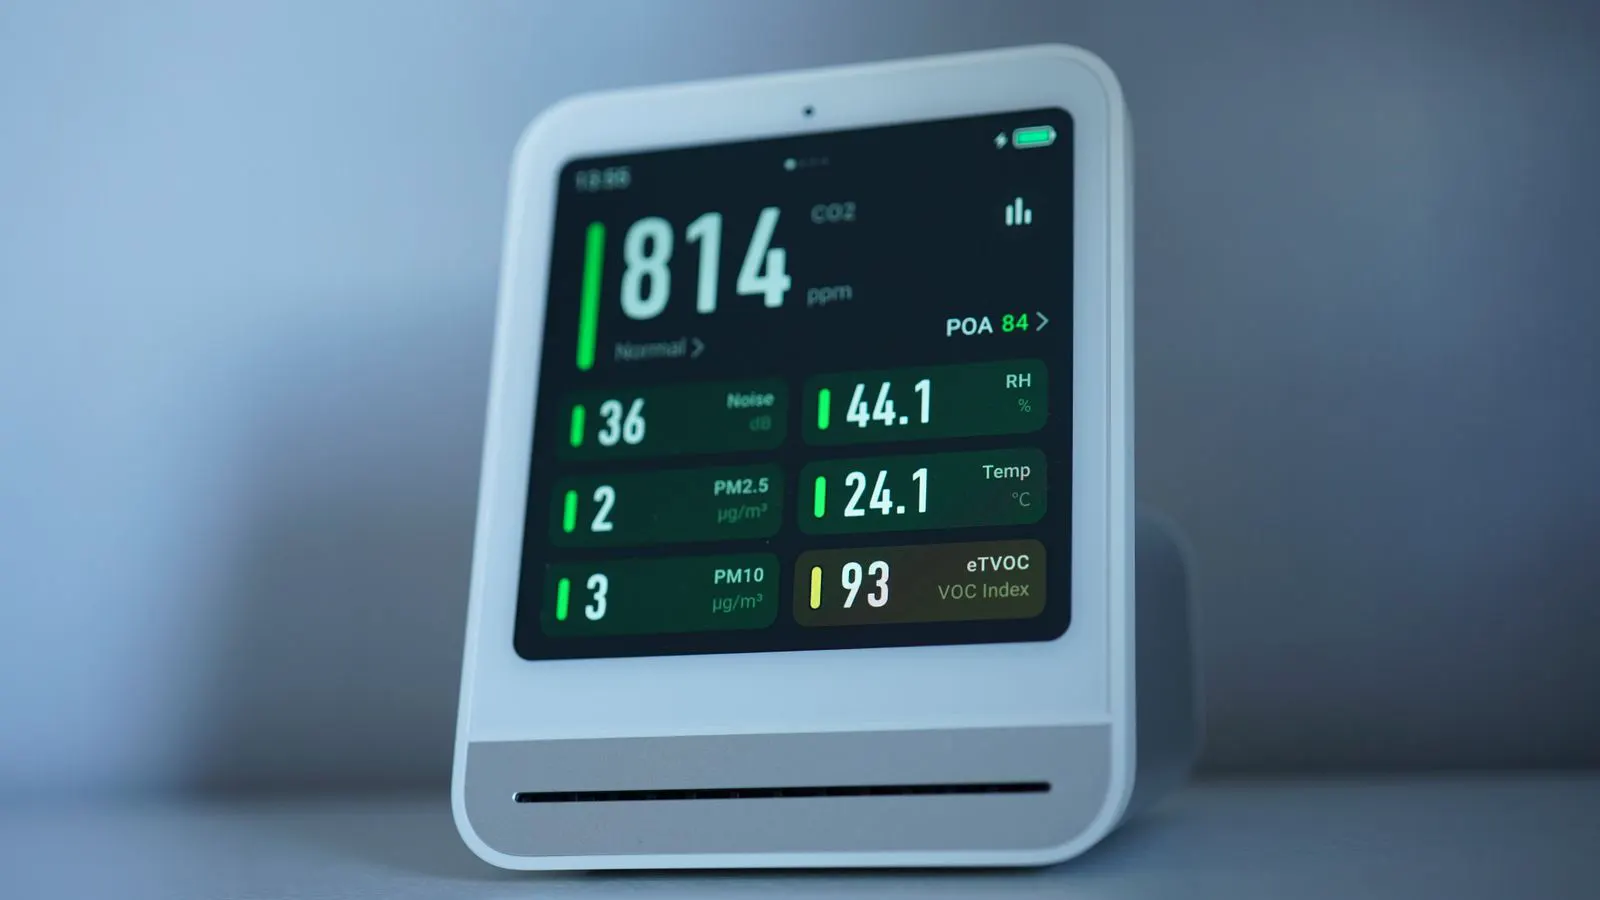
Digitalization closes that gap. It means connecting sensors, meters, and control systems into a single view of energy flow. Instead of checking a monthly invoice, operators see kWh usage per machine, per hour, or per batch. This shift moves energy from a financial abstract to an operational variable. An injection molding machine running at 150% of its optimal cycle temperature might appear normal in a monthly report, but real-time data reveals the sustained load and the associated cost per part.
For executives, this shift changes the conversation. Energy cost is no longer a line item at end of month. It becomes a live metric that can be managed in real time. When a plant manager walks onto the floor, they can see which line is currently the most energy-intensive. This allows for immediate intervention. If a cooling unit is running at full capacity while the production rate is low, the operator can adjust the setpoint or schedule a maintenance check. The data transforms energy from a backward-looking cost center into a forward-looking control parameter.
The change is not about replacing human judgment. It is about giving operators and managers better information so they can make faster decisions. A small change in cooling load, a drift in extruder temperature, or a misaligned valve can all show up in the data. A misaligned valve might cause a cooling circuit to operate at a suboptimal flow rate, increasing fan speed and pump load. Without data, this issue might not be detected for months. With data, the deviation in power draw is visible immediately. The key is that the data must be presented in a way that operators can understand and act upon. If the dashboard shows complex electrical parameters without context, it becomes noise. The goal is to translate raw kWh values into actionable insights, such as “Energy per kg of production is 12% above the baseline for this product.”
What real-time metering actually looks like on the floor
Real-time metering starts at the source. Each major machine gets a dedicated meter. Extruders, injection molding machines, dryers, and coolers all have their own power draw. These meters are typically installed at the main electrical panel of each machine or at the point of use. They measure voltage, current, and power factor, calculating real-time consumption. This hardware must be compatible with the plant’s existing PLCs and SCADA systems.
These meters feed into a central platform. Operators can see usage trends, spikes, and idle periods. A dryer running overnight with no production is an easy target. A cooling tower cycling more than expected shows up as a rising energy curve. The platform aggregates this data, allowing users to filter by time, machine, or product. For example, an operator can compare the energy usage of a specific mold across three different shifts. If the energy per shot is higher during the night shift, it might indicate a different material lot, a machine calibration drift, or operator error.
The practical value is immediate. You can spot waste without waiting for a quarterly audit. You can compare shifts, machines, or product runs against each other. This comparison is critical for identifying outliers. A machine that consistently uses 5% more energy than its identical counterpart on the same line is a prime candidate for investigation. The data helps distinguish between process inefficiency and equipment failure.
Buyers should ask vendors about meter resolution. Can the system show usage per minute, per hour, or per batch? The finer the resolution, the more useful the data becomes for optimization. A meter that only records hourly averages might miss a short spike caused by a stuck actuator or a faulty sensor. High-resolution data allows for correlation with production events. If a spike in power draw correlates with a specific cycle in the mold, the issue is likely mechanical or hydraulic. If it correlates with the start of a shift, it might be related to ambient temperature or operator habits. Vendors should also demonstrate how the data is stored and accessed. Can operators pull historical data for trend analysis? Is the data available to maintenance teams via mobile devices?
How predictive analytics changes maintenance planning
Predictive analytics uses historical data to forecast failures. In a plastics plant, a failing bearing or a leaking seal can waste energy long before it causes a breakdown. A worn bearing in a gear reducer increases friction, causing the motor to draw more current. A leaking hydraulic seal causes pressure loss, forcing the pump to work harder. These conditions do not always result in immediate downtime. They result in a gradual increase in energy consumption.
The system learns normal operating patterns. It establishes a baseline for each machine, considering variables like speed, temperature, and load. When a machine starts drawing more power at the same speed or temperature, it flags the anomaly. This gives maintenance teams time to fix the issue before it becomes a full stop. For instance, if a vacuum pump’s power draw increases by 10% over two weeks while the vacuum level remains stable, the system can alert maintenance to inspect the pump seal or the intake filter. This proactive approach prevents the sudden failure that would otherwise require an emergency parts shipment and line downtime.
This is a shift from reactive to proactive. Instead of replacing parts on a fixed schedule, plants fix them when the data says they need it. Fixed interval maintenance can lead to over-maintenance. Replacing a bearing before it wears out wastes parts and labor. It can also introduce new failures if the installation is not perfect. Predictive analytics allows for condition-based maintenance. The system monitors the actual health of the component and triggers service when the data indicates a threshold has been crossed.
For energy management, this means fewer hours of wasted power and fewer emergency repairs that disrupt production. It also reduces the risk of over-maintaining, which saves labor and parts costs. Predictive analytics requires a significant amount of historical data to train the models. New plants may need to operate for several months before the predictive models are accurate enough to be useful. Vendors should be transparent about the data requirements and the learning period. The analytics should be integrated into the existing maintenance management system, not just a separate dashboard. Alerts should be actionable, suggesting specific actions or pointing to relevant maintenance records.
The role of digital twins in energy planning
Digital twins are virtual models of the physical plant. They replicate how machines and processes interact. In a digital twin, you can test changes before touching the real equipment. The model is built using data from sensors, process parameters, and equipment specifications. It simulates the behavior of the plant under various conditions. For a plastics plant, the twin might include the extruder, the injection molding machine, the cooling system, and the dryer. It models the energy flow through these components.
For example, you can simulate a shift in production schedule to see how it affects peak energy demand. If the plant plans to run a high-energy product during the peak tariff period, the twin can calculate the cost and suggest alternative schedules. You can model the impact of adding a new cooling unit or changing a dryer cycle. By adjusting parameters in the virtual model, engineers can see the expected energy impact without interrupting production. This is particularly useful for capital projects. Before investing in a new machine or a process upgrade, the plant can estimate the energy savings or increase.
This helps executives plan capital projects with more confidence. Instead of guessing, they can see the expected energy impact of different scenarios. The twin can also be used to train operators. They can practice responding to anomalies in a safe environment. If the model shows a temperature drift, the operator can practice adjusting the setpoint and observe the consequences. This reduces the risk of making errors on the live plant.
The technology is still maturing. Not every plant has the data infrastructure for a full digital twin. Building an accurate model requires high-quality data and a deep understanding of the process. It is often more complex and expensive than simple metering. However, for large plants with multiple lines and complex processes, the value is significant. The direction is clear. As data quality improves and modeling tools become more accessible, these models will become more common. They bridge the gap between real-time monitoring and strategic planning.
Connecting energy data to sustainability reporting
Sustainability reporting is now a standard requirement for many buyers and regulators. Plants need to show their carbon footprint and energy use in a clear, auditable format. They must report on Scope 1 and Scope 2 emissions, which are directly linked to energy consumption. Digital systems make this easier. They automatically collect and store energy data. The same platform that shows real-time usage can generate reports for internal review or external audits.
This reduces the time spent gathering data manually. It also improves accuracy. Fewer manual entries mean fewer errors and a cleaner audit trail. Manual reporting often involves spreadsheets and estimates, which are prone to mistakes and difficult to verify. Automated reporting pulls data directly from the meters, ensuring consistency and traceability. The system can also calculate the carbon footprint based on the energy source mix. If the plant uses a mix of grid power and renewable energy, the software can allocate emissions accordingly.
For executives, this is a direct link between operational efficiency and corporate responsibility. The same data that helps cut energy bills also supports sustainability goals. A plant that reduces its energy consumption per unit of production will automatically reduce its carbon footprint. Digitalization provides the evidence needed to support these claims. It allows the plant to track progress over time and identify areas for further improvement. The reporting module should be flexible, allowing for different formats and standards. It should be able to export data to PDF, Excel, or other formats required by customers or regulators.
Staff readiness and training are the hidden bottlenecks
Technology alone does not change behavior. If operators do not understand the data, they will not act on it. The most common mistake is buying a dashboard and walking away. The dashboard goes live, and the data streams in, but no one looks at it. The system becomes a black box, and the plant continues to operate as before.
Training is a long-term investment. Operators need to know what the metrics mean and how to interpret them. They need to understand how their daily actions affect energy use. For example, an operator who knows that closing a valve too slowly increases the energy cost of the cooling cycle will adjust their habits. Training should be practical and hands-on. It should involve using the actual system and working through real scenarios.
This is not a one-time workshop. It requires ongoing education and clear communication. The best plants make energy metrics part of daily huddles and performance reviews. Operators discuss energy performance at the start of each shift. They set targets for the day and review results at the end. This creates a culture of accountability. Energy efficiency becomes part of the job, not an afterthought.
Buyers should factor training into their total cost of ownership. A system without user adoption is just a screen that no one looks at. Vendors should offer training packages that include initial setup, operator training, and ongoing support. The training should be tailored to the specific roles. Operators need to understand the basics and how to respond to alerts. Maintenance teams need to understand the deeper technical aspects and how to diagnose faults based on the data. Managers need to understand how to interpret trends and make strategic decisions.
What to do next: a practical preparation plan
Before buying any digital tool, establish a baseline. For two to three months, log energy use at the machine level. Note production volumes, shift patterns, and any known issues. This baseline gives you a reference point. It shows where the waste is and how much you can save. Without it, you cannot measure the impact of new tools.
This baseline period is critical. It allows you to understand the normal operating conditions of your plant. You might discover that energy use varies significantly by day of the week or by product mix. This information is essential for setting meaningful targets. It also helps you identify quick wins. If you find that a specific machine is running during idle periods, you can fix that before investing in new technology.
Then, define your goals. Do you want to reduce peak demand, cut dryer energy, or improve overall kWh per kg? Clear goals help you choose the right systems. If your goal is to reduce peak demand, you need a system that can monitor real-time load and suggest shifts. If your goal is to improve efficiency, you need a system that can track energy per unit of production and identify trends. The goals should be specific and measurable. For example, “Reduce energy consumption per kg of PVC by 5% within six months” is a clear goal. “Improve energy efficiency” is not.
Finally, start small. A single machine or one production line is enough to test a digital metering setup. Learn from the results, then expand. Starting small reduces risk and cost. It allows you to refine your approach before committing to a plant-wide system. It also helps you build confidence in the technology and the process. The results from the pilot will inform your strategy for the rest of the plant.
Comparison of common digital energy tools
| Tool | Primary Use | Typical Setup Time | Key Benefit |
|---|---|---|---|
| Machine-level meters | Track energy per machine | Days to weeks | Identifies waste at the source |
| Energy management platform | Central dashboard and reporting | Weeks to months | Combines data for easy analysis |
| Predictive analytics | Forecast failures and energy drift | Months | Reduces downtime and wasted power |
| Digital twin | Simulate process changes | Months to years | Tests scenarios before implementation |
| Sustainability reporting module | Generate audit-ready reports | Weeks | Speeds up compliance and internal review |
Preparation checklist for buyers
- Identify the top three energy-consuming machines on your floor.
- Check if existing meters can export data or if new hardware is needed.
- Decide who will own the data. Assign a clear role for monitoring and action.
- Plan a training schedule for operators and maintenance teams.
- Set a baseline period of at least two months before new tools go live.
Conclusion of the outlook
The direction is clear. Plants are moving from manual tracking to data-driven management. Digitalization is not a luxury. It is a practical way to cut energy costs and meet sustainability targets.
Executives should plan for these shifts. Start with visibility, add analytics, and build staff capability in parallel. The plants that act now will have a clear advantage in efficiency and reporting.
Frequently asked questions
Do small plants need the same digital tools as large ones?
Not necessarily. Small plants can start with basic machine-level meters and a simple dashboard. The goal is to track usage and find waste, not to build a full digital twin.
How long does it take to see energy savings after installing digital tools?
It depends on the baseline and the changes you make. Some plants spot and fix obvious waste within weeks. Others take months to tune processes and adjust behavior.
Can digital tools reduce the need for manual energy audits?
They reduce the frequency of manual audits. The system continuously collects data, so you do not need to send a team to the floor every quarter. You still need periodic reviews to check for errors or new issues.
Is a digital twin necessary for energy management?
No. Digital twins are useful for large plants with complex processes. For most plants, real-time metering and basic analytics are enough to manage energy effectively.
What is the biggest mistake plants make when adopting digital energy tools?
Buying the technology without training the people who will use it. If operators do not understand the data, they will not act on it. The system will sit unused.